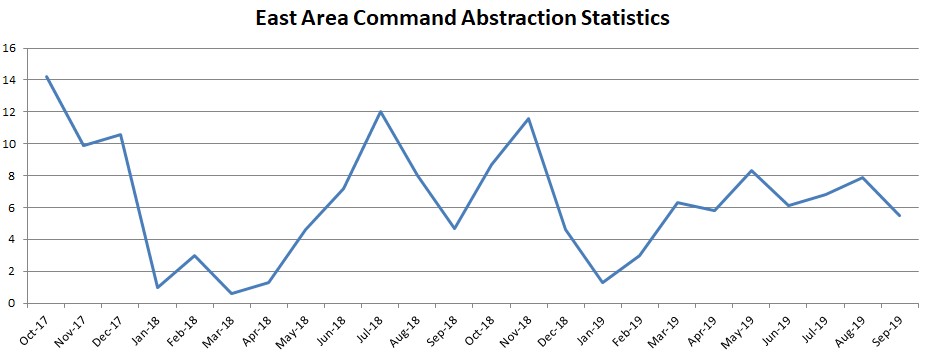
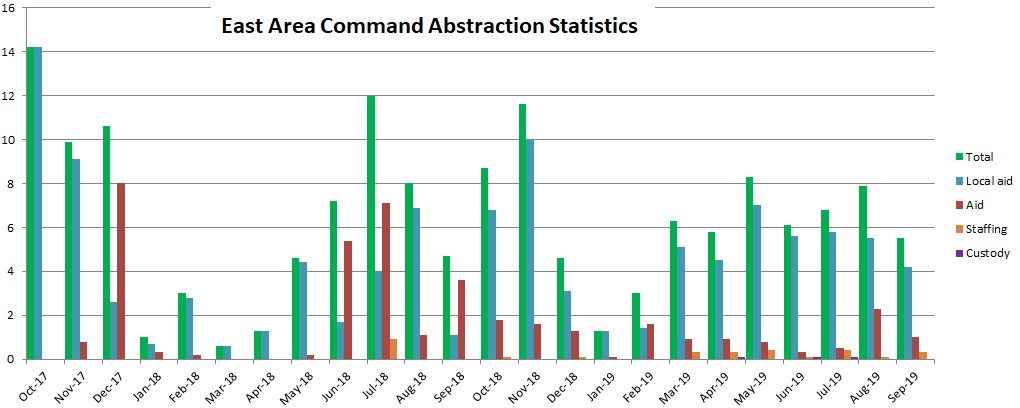
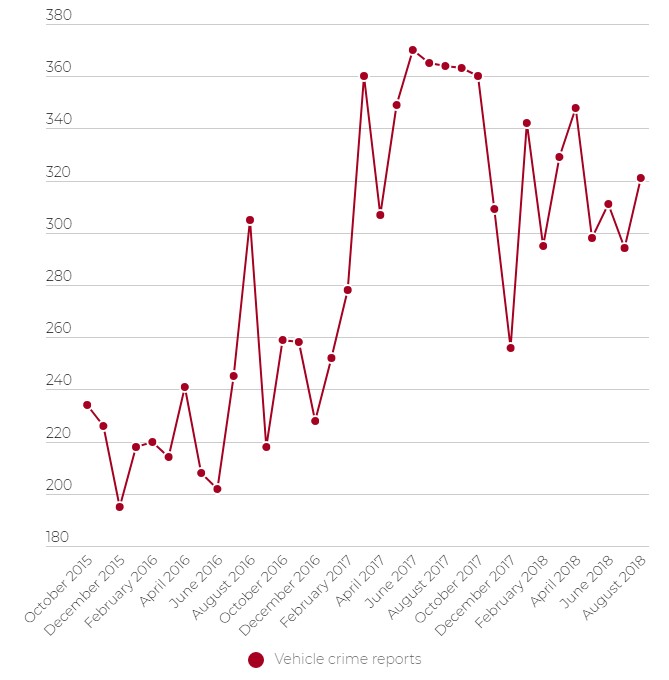
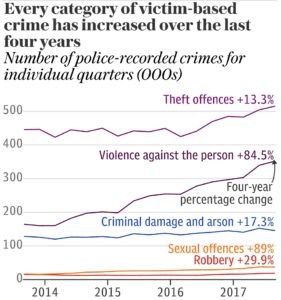
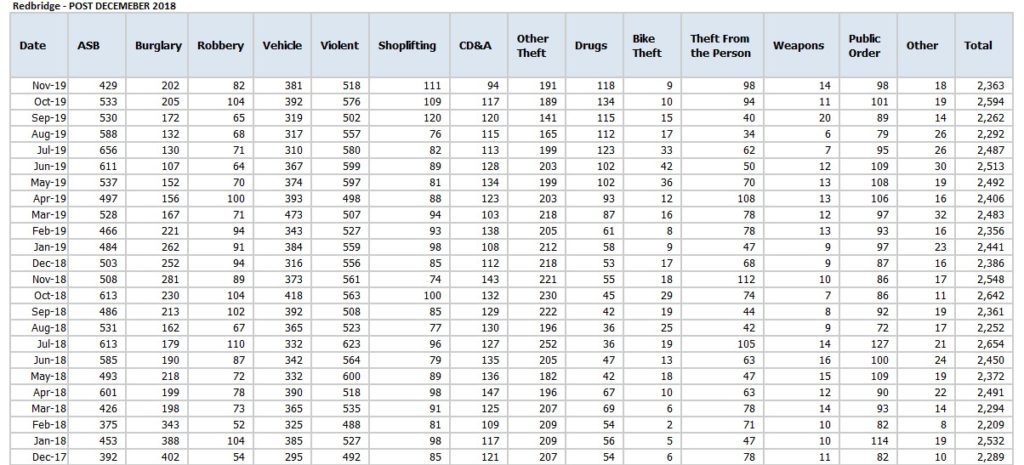
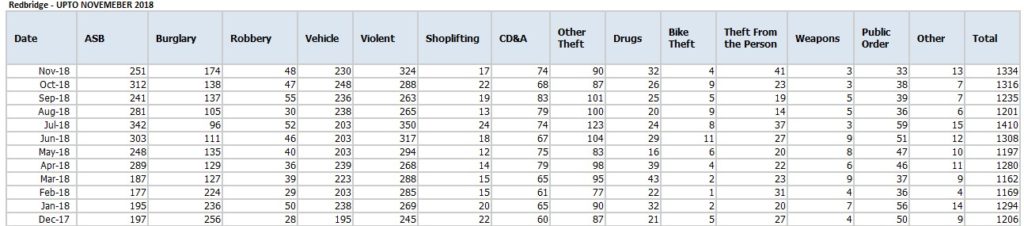
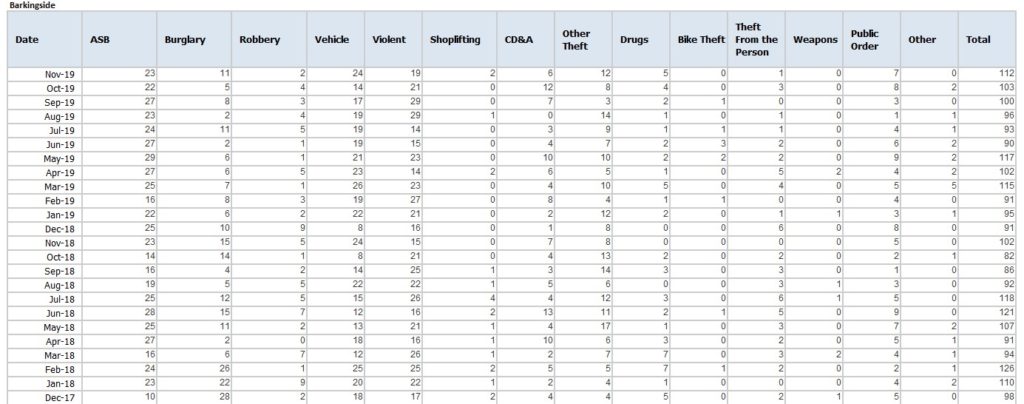
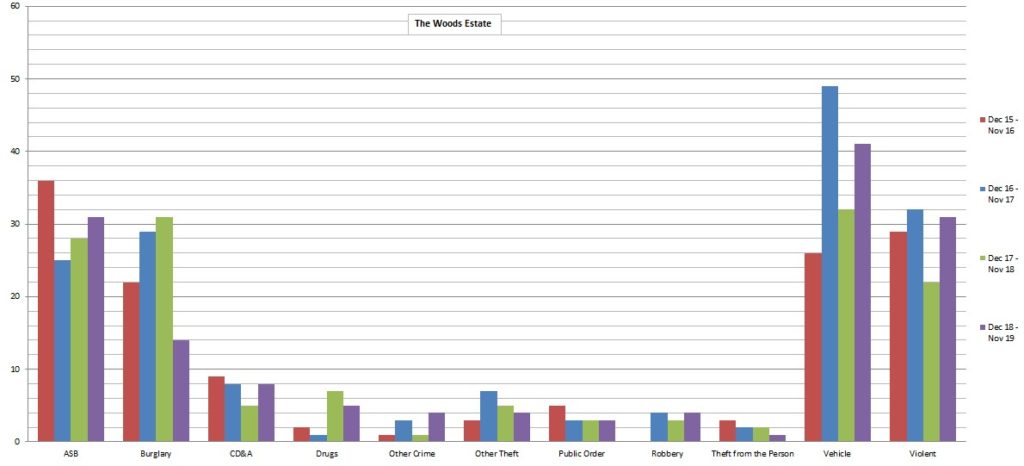
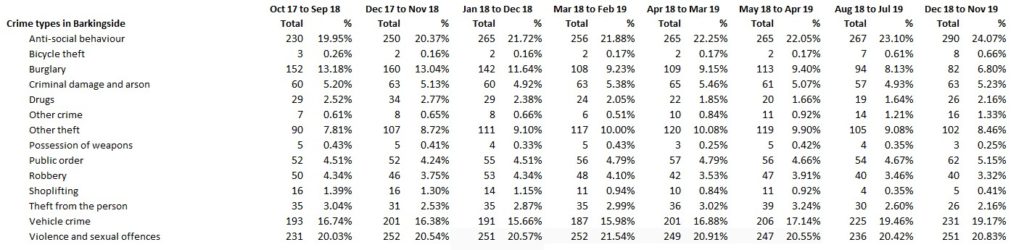
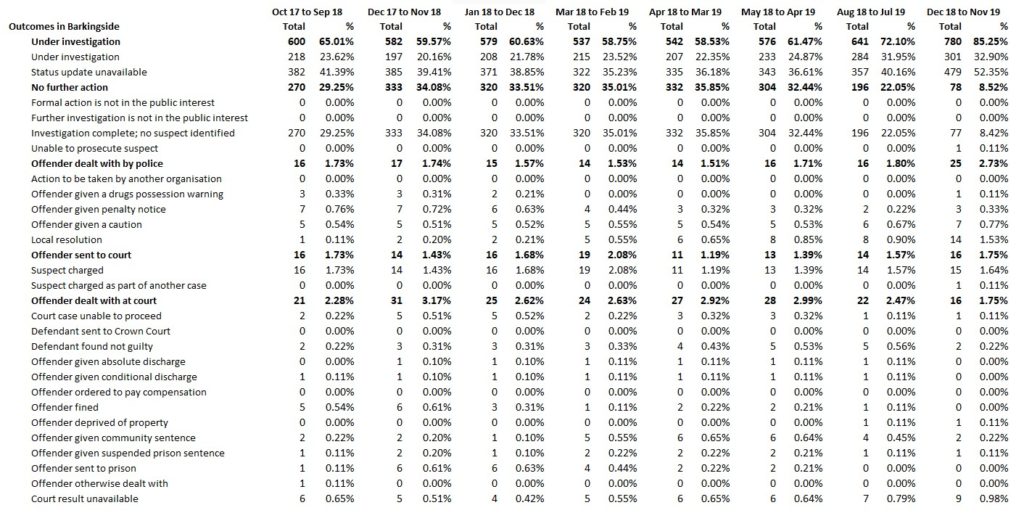
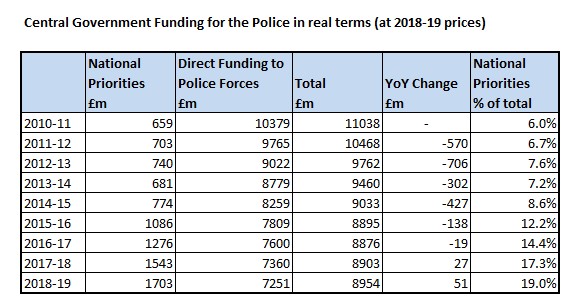
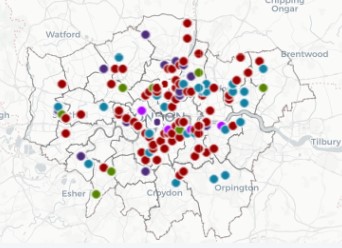
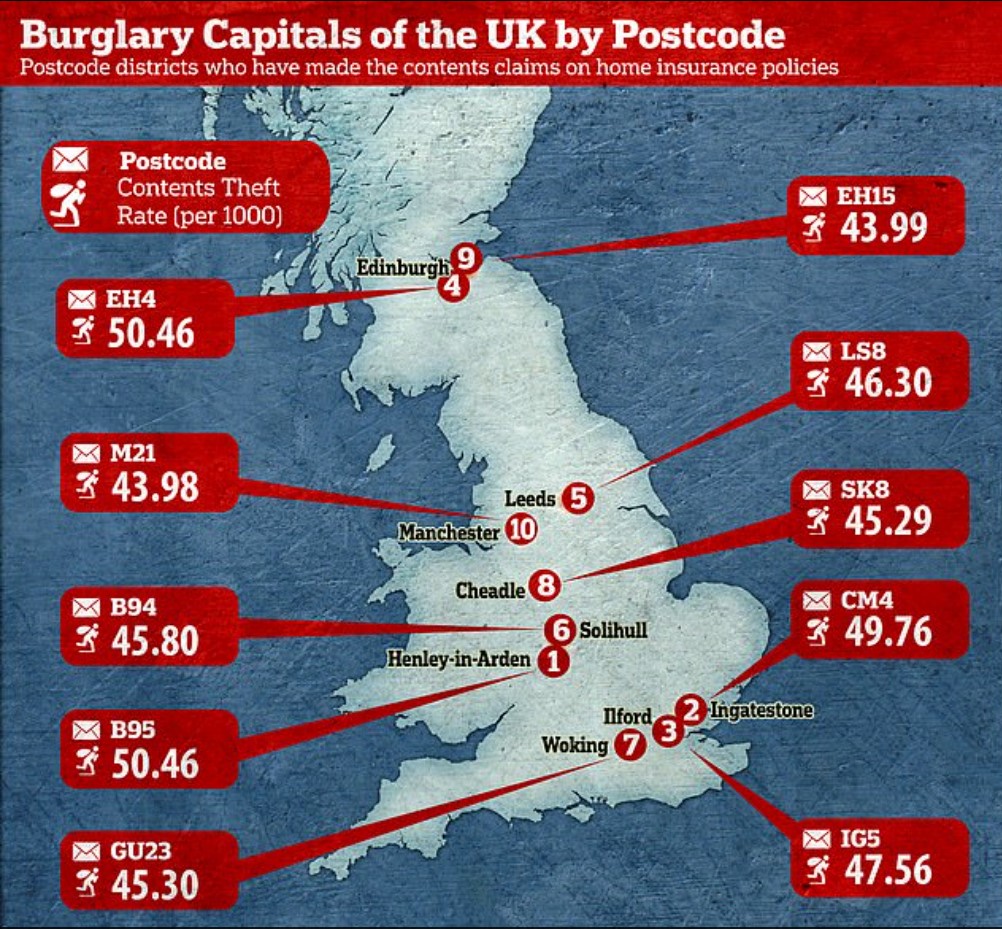
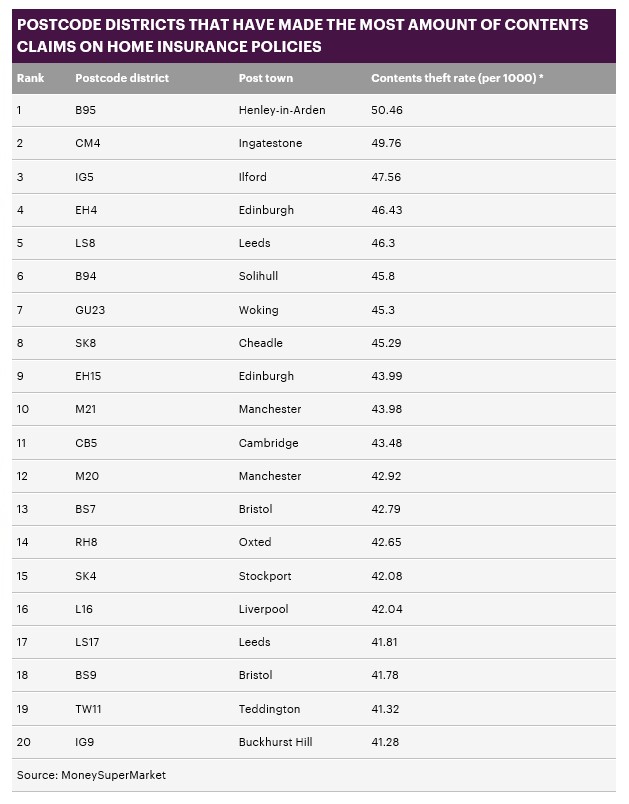
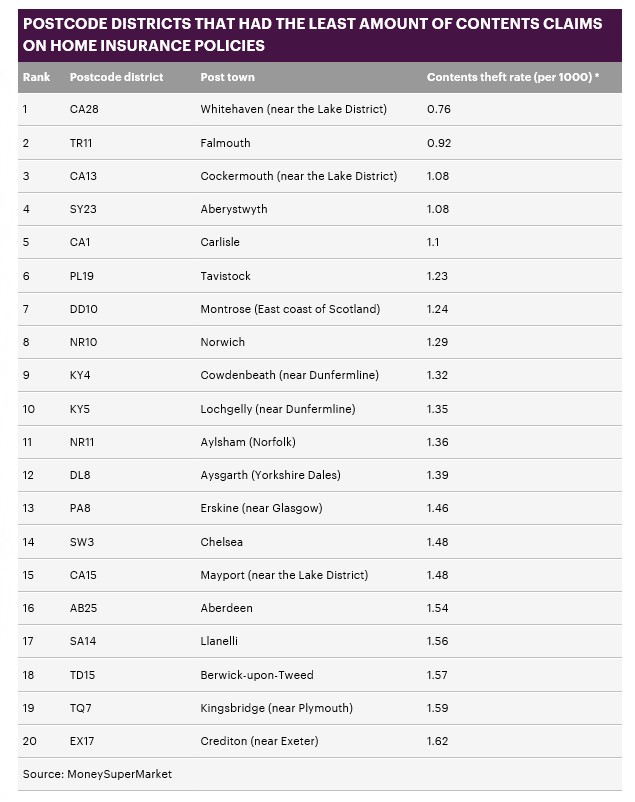
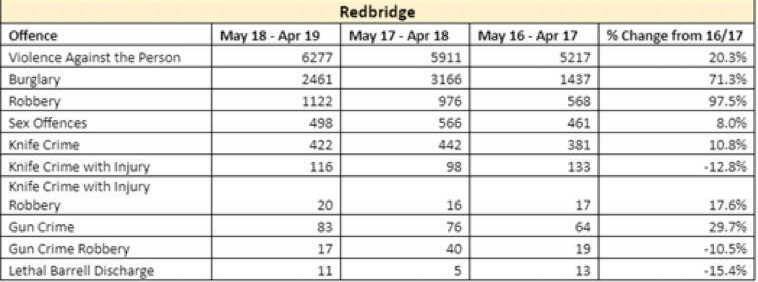
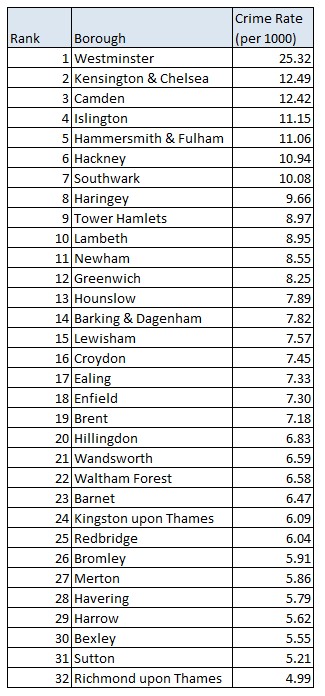
Stats Source: Evening StandardStatistics on 101 calls made.Between July 2017 and July 2018 there were 2,648,188 Met Police 101 calls.Of which 57% failed to complete their call – which is over 1.5m callsFrom these 1.5m calls 1,257,858 calls were “aborted” after an average 15 minute wait Source: Ilford RecorderStatistics on vehicle crime.Between October 2015 and August 2018 there were:9,943 reports from people in Redbridge relating to break ins, thefts from motor vehicles, damage and vehicle theft;9,745 cases are either still open, never updated or closed without a suspect identified;26 people have gone to prison during the period;11 people went to court but found not guilty;Nine court cases were not able to proceed.The top 3 wards for vehicle crime in Redbridge between October 2015 and August 2018 are:Valentines Ward – 722 crimes reportedWanstead – 703 crimes reportedSnaresbrook – 623 crimes reportedThe single worst affected location was Cranbrook Road with 51 offences taking place – resulting in only one person being taken to court. Source: Telegraph Source: Metropolitan PoliceCrime volumes by month for the London Borough of Redbridge Source: Metropolitan PoliceCrime volumes by month for the Barkingside Ward in the London Borough of Redbridge Source: Metropolitan PoliceCrime statistics for The Woods Estate Source: Police UK Source: Police UK Source: National Audit Office(Excludes funding from the local council tax support grant) Source: BBCHomicides in Redbridge (January 2018 – 17th December 2018)Red – Stabbing Blue – Assault Source: BBCHomicides in London (January 2018 – 17th December 2018)Red – Stabbing Blue – Assault Dark Purple – Shooting Light Purple – Fire Green – Other Source: Daily MailBurglary Capitals of the UK by PostcodePostcode districts who have made the contents claims on home insurance policies National average (Jan 2019) : 14.8 (per 1000)Ilford (Jan 2019) is only one of two areas in London that made the top 20 list – the other is Buckhurst Hill (IG9). Top 20 Bottom 20 Source: TwitterCrime Statistics for Redbridge Year-on-Year Source: https://www.mylondon.news/news/west-london-news/most-dangerous-boroughs-live-london-16767639The most dangerous boroughs to live in London according to police statistics – July 2019